2018-2019 Results
Early Years Foundation Stage
At the end of the Early Years Foundation Stage (EYFS: Nursery and Reception), children are assessed against a National EYFS Profile.
Significantly more children in our school achieve a Good Level of Development than children nationally, 88% of our children this year compared to last year’s national percentage of 72%
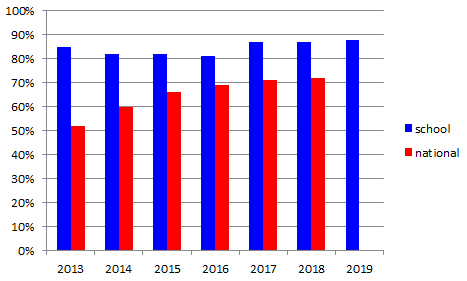
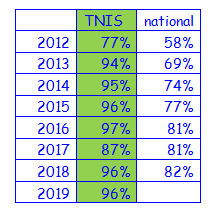
Year One Phonics Screening
Every Year One child across the whole country takes a Standardised Phonics Screening Check. Each test consists of 40 words: 20 “real” words and 20 “alien” words. Since 2012 when the phonics screen was introduced a much higher percentage of our children reached the expected standard than the percentage of children nationally,
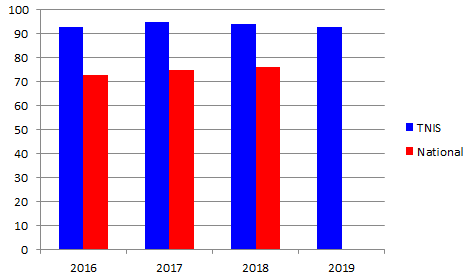
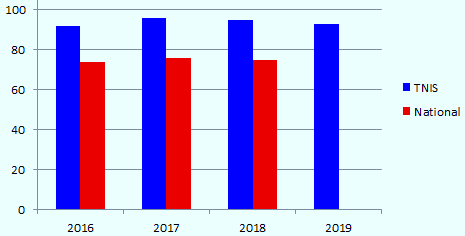
End of Key Stage One
At the end of Key Stage One (End of Year Two) all children in England are assessed against nationally published and moderated standards.
These assessments are carried out by the child’s class teacher. Teachers use the results from national curriculum tests in English and mathematics, commonly called SATs, along with the work your child has done throughout the year, to help them reach their judgements about how your child is achieving at the end of Key Stage 1. This year our school’s assessments were moderated as part of the routine national moderation programme. These moderations confirmed that our teachers are excellent at assessment; not only was every level agreed but our assessment practices were praised and some were even taken to share with other schools!
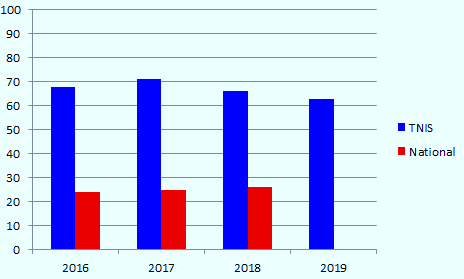
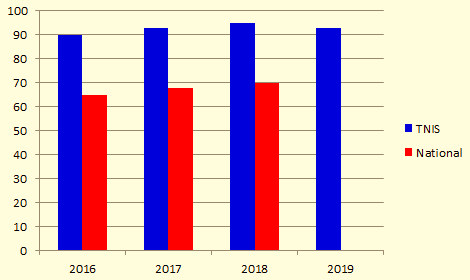
Our schools results for Working at the Expected Standard nationally and for working at Greater Depth than the Expected Standard are consistently well above national results.
Mathematics

The table on the left shows the percentage of children at the End of Key Stage One at expected or above in Mathematics. The second table shows the number of children at Greater depth then the expected standard at the End of Key Stage One in Mathematics.
78% of Pupils eligible for Pupil Premium Funding achieved expected or above in Mathematics.
Reading
The table on the left shows the percentage of children at the End of Key Stage One at expected or above in Reading. The second table shows the number of children at Greater depth then the expected standard at the End of Key Stage One in Reading.
78% of Pupils eligible for Pupil Premium Funding achieved expected or above in Reading.
Writing

The table on the left shows the percentage of children at the End of Key Stage One at expected or above in Writing. The second table shows the number of children at Greater depth then the expected standard at the End of Key Stage One in Writing
83% of Pupils eligible for Pupil Premium Funding achieved expected or above in Writing.
Notes. (1) Year on year variations in results reflect the make up of the year group being assessed –- for example results can be affected by numbers of children with Special Educational Needs or pupil mobility. (2) Assessment expectations from the Government change over time; Key Stage One assessment changed in the 2015-2016 academic year, The Early Years Foundation Stage Profile was new in the 2012- 2013 Academic year.
 |
2019 TNIS Results Overview | [pdf 408KB] |